python画图2

多折线图

Untitled

1
2
3
4
5
6
7
8
9
10
11
12
13
14
15
16
17
18
19
20
21
22
23
24
25
26
27
28
29
30
31
32
33
34
35
36
37
38
39
40
41
42
43
44
45
46
47
48
49
50
51
52
53
54
55
56
57
58
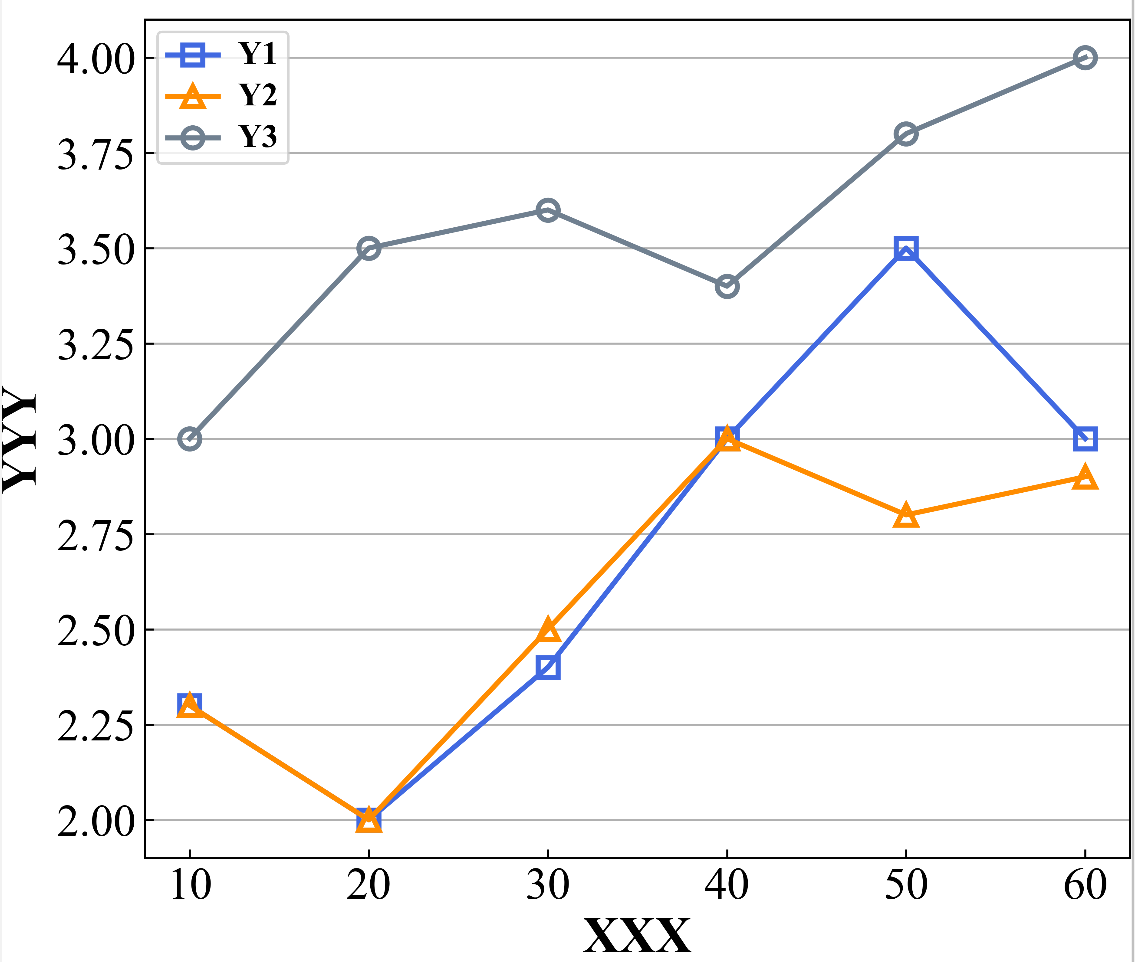
importmatplotlib.pyplotasplt
importmatplotlib.font_managerasfont_manager
importnumpyasnp
importpandasaspd
frommatplotlib.font_managerimportFontProperties

#设置字体加粗
font_props = font_manager.FontProperties(weight='bold')
#设置黑体字体
plt.rcParams['font.family'] ='Times New Roman'
plt.rcParams['font.sans-serif'] = ['SimHei']#用来正常显示中文标签
plt.rcParams['axes.unicode_minus'] =False#用来正常显示负号

if__name__ =='__main__':
fig = plt.figure(figsize=(7, 6))
ax1 = fig.add_subplot()

x_data = ['10','20','30','40','50','60']
Y1= [2.3,2,2.4,3,3.5,3]
Y2= [2.3,2,2.5,3,2.8,2.9]
Y3= [3,3.5,3.6,3.4,3.8,4]

line,=ax1.plot(x_data, Y1, color='royalblue', marker='s', linewidth=2, markersize=8, markerfacecolor='none',
markeredgewidth=2,label='Y1')
line1,=ax1.plot(x_data, Y2, color='darkorange', marker='^', linewidth=2, markersize=8, markerfacecolor='none',
markeredgewidth=2,label='Y2')
line2,=ax1.plot(x_data, Y3, color='slategray', marker='o', linewidth=2, markersize=8, markerfacecolor='none',
markeredgewidth=2,label='Y3')

ax1.set_xlabel("XXX",fontsize=20,weight='bold')
ax1.set_ylabel("YYY",fontsize=20,weight='bold')

#调整刻度值的字号
ax1.tick_params(axis='y', direction='in', labelsize=18)
ax1.tick_params(axis='x', direction='in', labelsize=18)

#设置y轴坐标值和间隔、显示范围
# y_ticks = np.arange(1.5, 3, 0.2) #设置X轴坐标值为1到5,间隔为1
# ax1.set_yticks(y_ticks)
# ax1.set_ylim(1.5, 2.9)
ax1.yaxis.grid(True)

#让左右边框值一致
ax2 = ax1.twiny()
#隐藏刻度线值
ax2.tick_params(axis='x', which='both', colors='white', labelsize=1,bottom=False, top=False, left=False, right=False,labelbottom=False, labelleft=False)

#合并图例
legend = [line,line1,line2]
labels = [l.get_label()forlinlegend]
legend = ax1.legend(legend, labels)#bbox_to_anchor=(1, 1)
#设置字体属性
font_props = FontProperties(weight='bold',size=13)
fortextinlegend.get_texts():
text.set_font_properties(font_props)

#导出为PNG文件,分辨率设置为100像素, bbox_inches='tight':去除坐标轴占用的空间 pad_inches=0:去除所有白边
plt.savefig('pngs/pic16.png', dpi=600, bbox_inches='tight', pad_inches=0)

折线图+柱状图+显示数据

Untitled

1
2
3
4
5
6
7
8
9
10
11
12
13
14
15
16
17
18
19
20
21
22
23
24
25
26
27
28
29
30
31
32
33
34
35
36
37
38
39
40
41
42
43
44
45
46
47
48
49
50
51
52
53
54
55
56
57
58
59
60
61
62
63
64
65
66
67
import matplotlib.pyplot as plt
import matplotlib.font_manager as font_manager
import numpy as np
from matplotlib.font_manager import FontProperties

# 设置字体加粗
font_props = font_manager.FontProperties(weight='bold')
# 设置黑体字体
plt.rcParams['font.family'] = 'Times New Roman'
plt.rcParams['font.sans-serif'] = ['SimHei'] # 用来正常显示中文标签
plt.rcParams['axes.unicode_minus'] = False # 用来正常显示负号

if __name__ == '__main__':
# 设置图表的长和高
fig = plt.figure(figsize=(7, 6)) # 设置图表的宽度为8,高度为6
# 创建轴
ax1 = fig.add_subplot()

x_data = np.arange(3)
tick_label = ['1','2','3']
y_data = [1.5,2.5,2.4]
y_data1=[1.1,1.4,1.2]
y_data2 = [0.8,0.74,0.7]

# 绘制第1个轴
bar = ax1.bar(x_data - 0.1, y_data, width=0.2, color='royalblue', label='11', zorder=100,
hatch='/')
bar1 = ax1.bar(x_data + 0.1, y_data1, width=0.2, color='orange', label='22', zorder=100,
hatch='\\')

# 设置X刻度标签
ax1.set_xticks(x_data )
ax1.set_xticklabels(tick_label)

ax1.set_ylabel("YYY", fontsize=20, weight='bold')
ax1.tick_params(axis='y', direction='in',labelsize=18)
ax1.tick_params(axis='x', direction='in',labelsize=18)

y_ticks = np.arange(0, 3.1, 0.5)
ax1.set_ylim([0, 3])
ax1.yaxis.grid(True, zorder=0)

# 绘制第2个轴
ax2 = ax1.twinx()
line,=ax2.plot(x_data, y_data2, color='grey',marker='s', label="33", linewidth=2, markersize=8, markerfacecolor='none',
markeredgewidth=2)

# 在每个点上显示数值
for x, y in zip(x_data, y_data2):
ax2.annotate(f'{y}', (x, y-0.03), textcoords="offset points", xytext=(2, 17), ha='center', size=17,
weight='bold')

ax2.set_ylabel("Y22", fontsize=20, weight='bold')
ax2.tick_params(axis='y', direction='in',labelsize=18)
ax2.set_ylim([0, 0.9])

# 合并图例
legend = [bar, bar1,line]
labels = [l.get_label() for l in legend]
legend=ax1.legend(legend, labels,bbox_to_anchor=(0.38, 0.67))
# 设置字体属性
font_props = FontProperties(weight='bold', size=17)
for text in legend.get_texts():
text.set_font_properties(font_props)

# 导出为PNG文件,分辨率设置为100像素, bbox_inches='tight':去除坐标轴占用的空间 pad_inches=0:去除所有白边
plt.savefig("pngs/pic13.png", dpi=600, bbox_inches='tight', pad_inches=0)

并排多柱状图

Untitled

1
2
3
4
5
6
7
8
9
10
11
12
13
14
15
16
17
18
19
20
21
22
23
24
25
26
27
28
29
30
31
32
33
34
35
36
37
38
39
40
41
42
43
44
45
46
47
48
49
50
51
52
53
54
55
56
57
58
59
60
61
import matplotlib.pyplot as plt
import matplotlib.font_manager as font_manager
import numpy as np
from matplotlib.font_manager import FontProperties

# 设置字体加粗
font_props = font_manager.FontProperties(weight='bold')
# 设置黑体字体
plt.rcParams['font.family'] = 'Times New Roman'
plt.rcParams['font.sans-serif'] = ['SimHei'] # 用来正常显示中文标签
plt.rcParams['axes.unicode_minus'] = False # 用来正常显示负号

if __name__ == '__main__':
# 设置图表的长和高
fig = plt.figure(figsize=(7, 6)) # 设置图表的宽度为8,高度为6
# 创建轴
ax1 = fig.add_subplot()

x_data = np.arange(5)
tick_label = ['2^14','2^15','2^16','2^17','2^18']
y_data = [0.81, 0.82, 0.83, 0.84, 0.85]
y_data1=[0.7, 0.72, 0.74, 0.76, 0.78]
y_data2 = [0.6, 0.64, 0.68, 0.72, 0.76]

# 绘制第1个轴
bar = ax1.bar(x_data - 0.2, y_data, width=0.2, color='royalblue', label='1', zorder=100,
hatch='/')
bar1 = ax1.bar(x_data + 0, y_data1, width=0.2, color='orange', label='2', zorder=100,
hatch='\\')
bar2 = ax1.bar(x_data + 0.2, y_data2, width=0.2, color='grey', label='3', zorder=100,
hatch='.')

ax1.set_xlabel("XXX", fontsize=20, weight='bold')
# 设置X刻度标签
ax1.set_xticks(x_data )
ax1.set_xticklabels(tick_label)

ax1.set_ylabel("YYY", fontsize=20, weight='bold')
ax1.tick_params(axis='y', direction='in',labelsize=18)
ax1.tick_params(axis='x', direction='in',labelsize=18)

y_ticks = np.arange(0.6, 0.91, 0.05)
ax1.set_ylim([0.6, 0.9])
ax1.yaxis.grid(True, zorder=0)

#让左右边框值一致
ax2 = ax1.twiny()
# 隐藏刻度线值
ax2.tick_params(axis='x', which='both', colors='white', labelsize=1,bottom=False, top=False, left=False, right=False,labelbottom=False, labelleft=False)

# 合并图例
legend = [bar, bar1,bar2]
labels = [l.get_label() for l in legend]
legend=ax1.legend(legend, labels,bbox_to_anchor=(0.82, 1),ncol=3)
# 设置字体属性
font_props = FontProperties(weight='bold', size=17)
for text in legend.get_texts():
text.set_font_properties(font_props)

# 导出为PNG文件,分辨率设置为100像素, bbox_inches='tight':去除坐标轴占用的空间 pad_inches=0:去除所有白边
plt.savefig("pngs/pic23.png", dpi=600, bbox_inches='tight', pad_inches=0)