python画图1

折线图

Untitled

1
2
3
4
5
6
7
8
9
10
11
12
13
14
15
16
17
18
19
20
21
22
23
24
25
26
27
28
29
30
31
32
33
34
35
36
37
38
39
40
41
42
43
44
45
46
47
48
49
50
import matplotlib.pyplot as plt
import matplotlib.font_manager as font_manager
import numpy as np

# 设置字体加粗
font_props = font_manager.FontProperties(weight='bold')
# 设置黑体字体
plt.rcParams['font.family'] = 'Times New Roman'
plt.rcParams['font.sans-serif'] = ['SimHei'] # 用来正常显示中文标签
plt.rcParams['axes.unicode_minus'] = False # 用来正常显示负号

if __name__ == '__main__':
# 设置图表的长和高
fig = plt.figure(figsize=(6, 5)) # 设置图表的宽度为8,高度为6

# 创建轴
ax1 = fig.add_subplot()
# fig,ax1 = plt.subplots()
# plt.rcParams['axes.linewidth'] = 3
# fig.subplots_adjust(left=0, bottom=0) #调整图的四周间距
# ax1.spines['right'].set_visible(False) # 右边
# ax1.spines['top'].set_visible(False) # 上边

x_data = ['1', '5', '10', '15', '25', '50', '100', '150', '200', '250']
y_data =[0.7,0.5,0.6,0.4,0.3,0.4,0.2,0.1,0.1,0.6]

ax1.plot(x_data, y_data, color='royalblue',marker='s',linewidth=2, markersize=8,markerfacecolor='none',markeredgewidth=2)

ax1.set_xlabel("XXX",fontsize=20,weight='bold')
ax1.set_ylabel("YYY",fontsize=20,weight='bold')
# 调整刻度值的字号
ax1.tick_params(axis='y', direction='in', labelsize=18)
ax1.tick_params(axis='x', direction='in', labelsize=18)
# 设置Y轴显示范围
ax1.set_ylim(0, 1)
ax1.yaxis.grid(True)

#让左右边框值一致
ax2 = ax1.twiny()
# 隐藏刻度线值
ax2.tick_params(axis='x', which='both', colors='white', labelsize=1,bottom=False, top=False, left=False, right=False,labelbottom=False, labelleft=False)

# ax1.spines['right'].set_linewidth(1.5)
# ax1.spines['left'].set_lignewidth(1.5)
# ax1.spines['top'].set_linewidth(1.5)
# ax1.spines['bottom'].set_linewidth(1.5)

# plt.legend(); #不需要图例时不调用
# 导出为PNG文件,分辨率设置为100像素, bbox_inches='tight':去除坐标轴占用的空间 pad_inches=0:去除所有白边
plt.savefig('pngs/pic1.png', dpi=600, bbox_inches='tight', pad_inches=0)

柱状图

Untitled

1
2
3
4
5
6
7
8
9
10
11
12
13
14
15
16
17
18
19
20
21
22
23
24
25
26
27
28
29
30
31
32
33
34
35
36
37
38
39
40
41
42
import matplotlib.pyplot as plt
import matplotlib.font_manager as font_manager
import numpy as np
# 设置字体加粗
font_props = font_manager.FontProperties(weight='bold')
# 设置黑体字体
plt.rcParams['font.family'] = 'Times New Roman'
plt.rcParams['font.sans-serif'] = ['SimHei'] # 用来正常显示中文标签
plt.rcParams['axes.unicode_minus'] = False # 用来正常显示负号

if __name__ == '__main__':
# hatch_par = ['/', '', '|', '-', '+', 'x', 'o', 'O', '.', '*']
fig = plt.figure()
ax1 = fig.add_subplot()

x_data = ['5','10','15','20','25','30','35','40']
y_data =[0.04,0.02,0.03,0.05,0.05,0.04,0.02,0.05]
y_data1 = [0.03,0.03,0.03,0.06,0.04,0.06,0.02,0.02]

F2 = ax1.bar(x_data, y_data1, color='royalblue', width=0.5,label='---',zorder=100,hatch='/')
F1 = ax1.bar(x_data, y_data, color='orange', width=0.5, bottom=y_data1, label='...',zorder=100,hatch='\\')

ax1.set_xlabel("XXX", fontsize=20, weight='bold')
ax1.set_ylabel("YYY", fontsize=20, weight='bold')
# 调整刻度值的字号
ax1.tick_params(axis='y', direction='in', labelsize=18)
ax1.tick_params(axis='x', direction='in', labelsize=18)

# 设置Y轴显示范围
ax1.set_ylim(0, 0.12)
ax1.yaxis.grid(True)

# 让左右边框值一致
ax2 = ax1.twiny()
# 隐藏刻度线值
ax2.tick_params(axis='x', which='both', colors='white', labelsize=1, bottom=False, top=False, left=False,
right=False, labelbottom=False, labelleft=False)
legend = [F1, F2]
labels = [l.get_label() for l in legend]
legend = ax1.legend(legend, labels, fontsize=10)

plt.savefig('pngs/pic7.png', dpi=600, bbox_inches='tight', pad_inches=0)

折线+柱状图

Untitled

1
2
3
4
5
6
7
8
9
10
11
12
13
14
15
16
17
18
19
20
21
22
23
24
25
26
27
28
29
30
31
32
33
34
35
36
37
38
39
40
41
42
43
44
45
46
47
48
49
50
51
52
53
54
55
56
57
58
59
60
61
62
63
64
65
66
67
68
import matplotlib.pyplot as plt
import matplotlib.font_manager as font_manager
import numpy as np
from matplotlib.font_manager import FontProperties
import matplotlib.ticker as ticker

# 设置字体加粗
font_props = font_manager.FontProperties(weight='bold')
# 设置黑体字体
plt.rcParams['font.family'] = 'Times New Roman'
plt.rcParams['font.sans-serif'] = ['SimHei'] # 用来正常显示中文标签
plt.rcParams['axes.unicode_minus'] = False # 用来正常显示负号
plt.rcParams.update({'font.size': 17})
if __name__ == '__main__':
# 设置图表的长和高
fig = plt.figure(figsize=(6, 5)) # 设置图表的宽度为8,高度为6
fig.set_size_inches(6, 5)
# 创建轴
ax1 = fig.add_subplot()

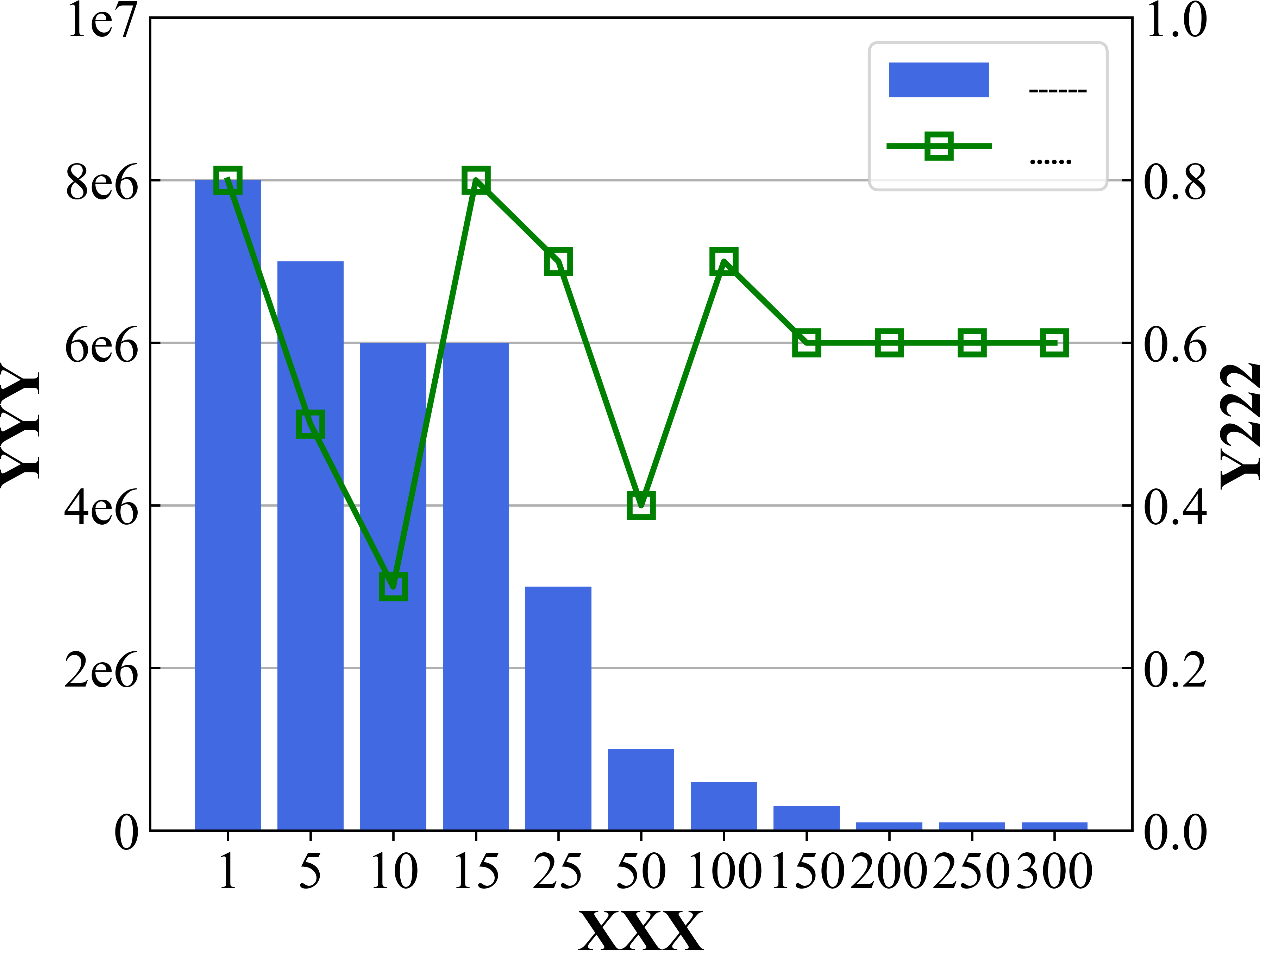
x_data = ['1','5','10','15','25','50','100','150','200','250','300']
y_data = [8000000,7000000,6000000,6000000,3000000,1000000,600000,300000,100000,100000,100000] #Entry replacement count
# x_data2 = [0,0.1,0.2,0.3,0.4,0.5,0.6,0.7,0.8,0.9,1.0]
y_data2=[0.8,0.5,0.3,0.8,0.7,0.4,0.7,0.6,0.6,0.6,0.6] #Prediction ratio

# 绘制第1个轴
bar=ax1.bar(x_data, y_data, color='royalblue', label="------",zorder=100)

# ax1.ticklabel_format(style='sci', axis='y', scilimits=(0, 0),useMathText=True)
# 自定义y轴标签
def exp_formatter(x, pos):
# print(x)
if x == 0.0:
return f'{0}'
elif x < 10000000:
x = x / 1000000
return f'{x:.0f}e6'
else:
x = x / 10000000
return f'{x:.0f}e7'
ax1.yaxis.set_major_formatter(ticker.FuncFormatter(exp_formatter))

ax1.set_xlabel("XXX", fontsize=20, weight='bold')
ax1.set_ylabel("YYY", fontsize=20, weight='bold')
ax1.tick_params(axis='y', direction='in',labelsize=18)
ax1.tick_params(axis='x', labelsize=18)
ax1.set_ylim([0, 10000000])
ax1.yaxis.grid(True, zorder=0)

# 绘制第2个轴
ax2 = ax1.twinx()
line,=ax2.plot(x_data, y_data2, 'gs-', label="......", linewidth=2, markersize=8, markerfacecolor='none',
markeredgewidth=2)
# ax2.set_xlabel("Time window size(s)", fontsize=20, weight='bold')
ax2.set_ylabel("Y222", fontsize=20, weight='bold')
ax2.tick_params(axis='y', direction='in',labelsize=18)
ax2.set_ylim([0, 1])

# 合并图例
legend = [bar, line]
labels = [l.get_label() for l in legend]
legend=ax1.legend(legend, labels,bbox_to_anchor=(1, 1))
# 设置字体属性
font_props = FontProperties(weight='bold', size=10)
for text in legend.get_texts():
text.set_font_properties(font_props)

plt.savefig("pngs/pic3.png", dpi=600, bbox_inches='tight', pad_inches=0)